From RBN Energy:
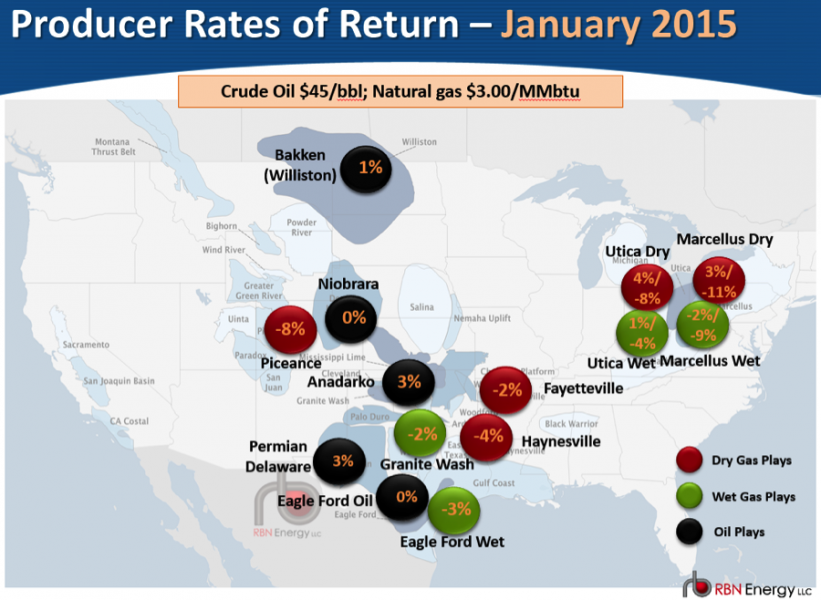
On Friday (January 23, 2015) West Texas Intermediate (WTI) futures
prices closed under $46/Bbl for the second time this year. RBN’s
analysis of producer internal rates of return (IRRs) for typical oil
wells indicates that Bakken IRRs have fallen from 39% in the fall of
2014 to just 1% today. IRRs for typical Permian wells are down to 3% and
typical Eagle Ford wells are at breakeven. Everything is underwater or
close to it except for the sweet spot wells with higher production.
Today we present highlights from RBN’s IRR and breakeven analysis –
published in full today in our latest Drill Down Report.
In Episode 1 of
this series we reviewed recent price carnage in crude, natural gas and
natural gas liquids (NGL) markets that have crushed the IRRs producers
enjoyed in the summer of 2014 and resulted in much speculation about the
impact on current and future production. We noted that existing wells
currently flowing will continue to produce – there is no value to
shutting in output because of falling prices. That is because even at
today’s prices, the per-unit revenues of existing wells are
significantly above operating costs. In fact, production is likely to
increase in the near term. Our expectations of production increases in
2015 are reinforced by recent investor presentations (see Rig Cuts Deep Output High). In Episode 2
we ran through the inputs and model assumptions behind our IRR and
breakeven sensitivity analysis using RBN’s Production Economics model.
Coming up with representative input variables for the model is as much
art as science but the main goal is to understand how the numbers relate
to each other. Most analysts make you guess what the input variables
are, so you really don’t know what you are looking at. We lay it out
for you so you can make your own judgments about whether or not our data
is truly representative. In this final episode in the series we present
highlights of our analysis results. The full results are available
exclusively to RBN Backstage Pass subscribers in our latest Drill Down report (for more details see the Ad below).
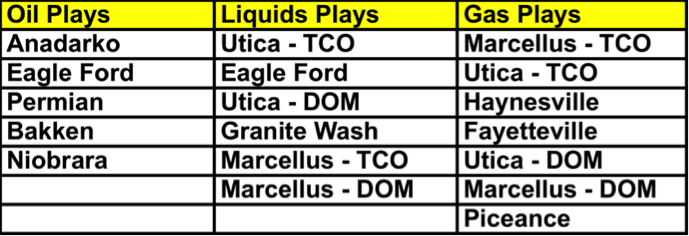
The primary goal of our analysis was to identify typical IRRs in
different crude oil and natural gas price scenarios for major shale
plays across the U.S. at various crude and natural gas price levels. We
analyzed data from a range of wells for each of the basins in Table #1
and aggregated the results to provide values for representative wells in
oil, liquids (NGLs) and natural gas categories. From the set of
representative wells for each play we then extracted a super set of
“sweet spot” wells having the highest IP rates that produce the highest
IRRs. We used these wells to identify sweet spot well characteristics.
Table #1 Source: RBN Energy (Click to Enlarge)
Then and Now
The following snapshots provide a summary of our results for typical
IRRs seen in oil, wet gas (NGLs) and dry gas plays under different price
scenarios during the fall of 2014 and in January of 2015. The complete
results along with summarized input data that generated these outputs
are available in the Drill Down Report....MORE