From StockCharts:
As I am living in Commodityville, Calgary, Canada, watching a 40-year trend line break on the $CRB could not be more disturbing.
The previous intraday low was 181.83. Today we 'closed' at 180.85 and the intraday low was 180.72. The intraday low today was more than 1 point below the 40-year level. Here is the chart and then we can discuss the magnitude of the breakdown.
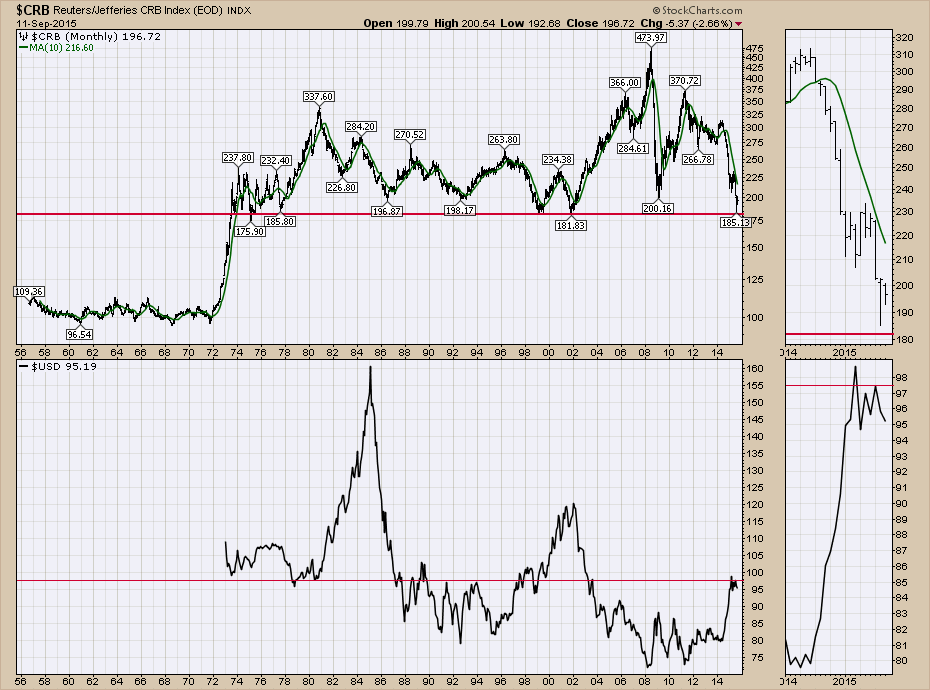
First of all, the $USD has been way, way higher than the current level to cause the previous lows in the commodity complex as the chart shows. 1985 and 2002 had $USD peaks much higher than this. An interesting point to observe is at the 1999 low in the $CRB when the dollar moved above resistance at a level similar to now. The perspective that we can make 40-year lows in commodities while the stock markets move up on the assumption that it is business as usual is bizarre to me. It can not be perceived as bullish to have demand so low for all the commodities that you take out forty-year pricing lows. This means the demand relative to supply for commodities is below the financial crisis when the world stopped. It is below the levels of major global recessions for 40 years. It is below the level of weather related effects. It is below the level of pre and post-war demand. It is below the level of anything most of us have seen in our investing lifetimes. Art Cashin's 60 years on the floor might have seen more!
When major trend lines break, the longer the trend line, the more significant the underlying story being told. A forty year trend breaking in something comprised of the key ingredients to the global supply chain is not a heartwarming moment of 'That's bullish!'. While those in the finance business or retail blow this off as no big deal, this chart is suggesting to me that the manufacturing growth of the last forty years is changing. Perhaps it is simply a case of oversupply by having a buoyant commodity market and the world needs time to catch up. Well, the last three times prices were this low in the most recent 25 years were all recessionary periods. 1990-1992 was a recessionary period. 1999-2002 bookended the tech crash, recession, 9/11 and the start of the Gulf war. 2008 was obviously a recessionary period that was very fast as commodities were soaring while Bear Stearns was closing. ...MORE